Drone Coastal Erosion Monitoring
Monitor changing coastlines with repeatable aerial mapping and 3D surface data.
Droneacres provides coastal mapping and photogrammetric modelling to help document changes in cliffs, dunes and shorelines over time. Repeat surveys can be compared to identify visible erosion, deposition and changes in coastal terrain.
Prefer to talk it through? Call 07970 393381.

How drone monitoring shows change
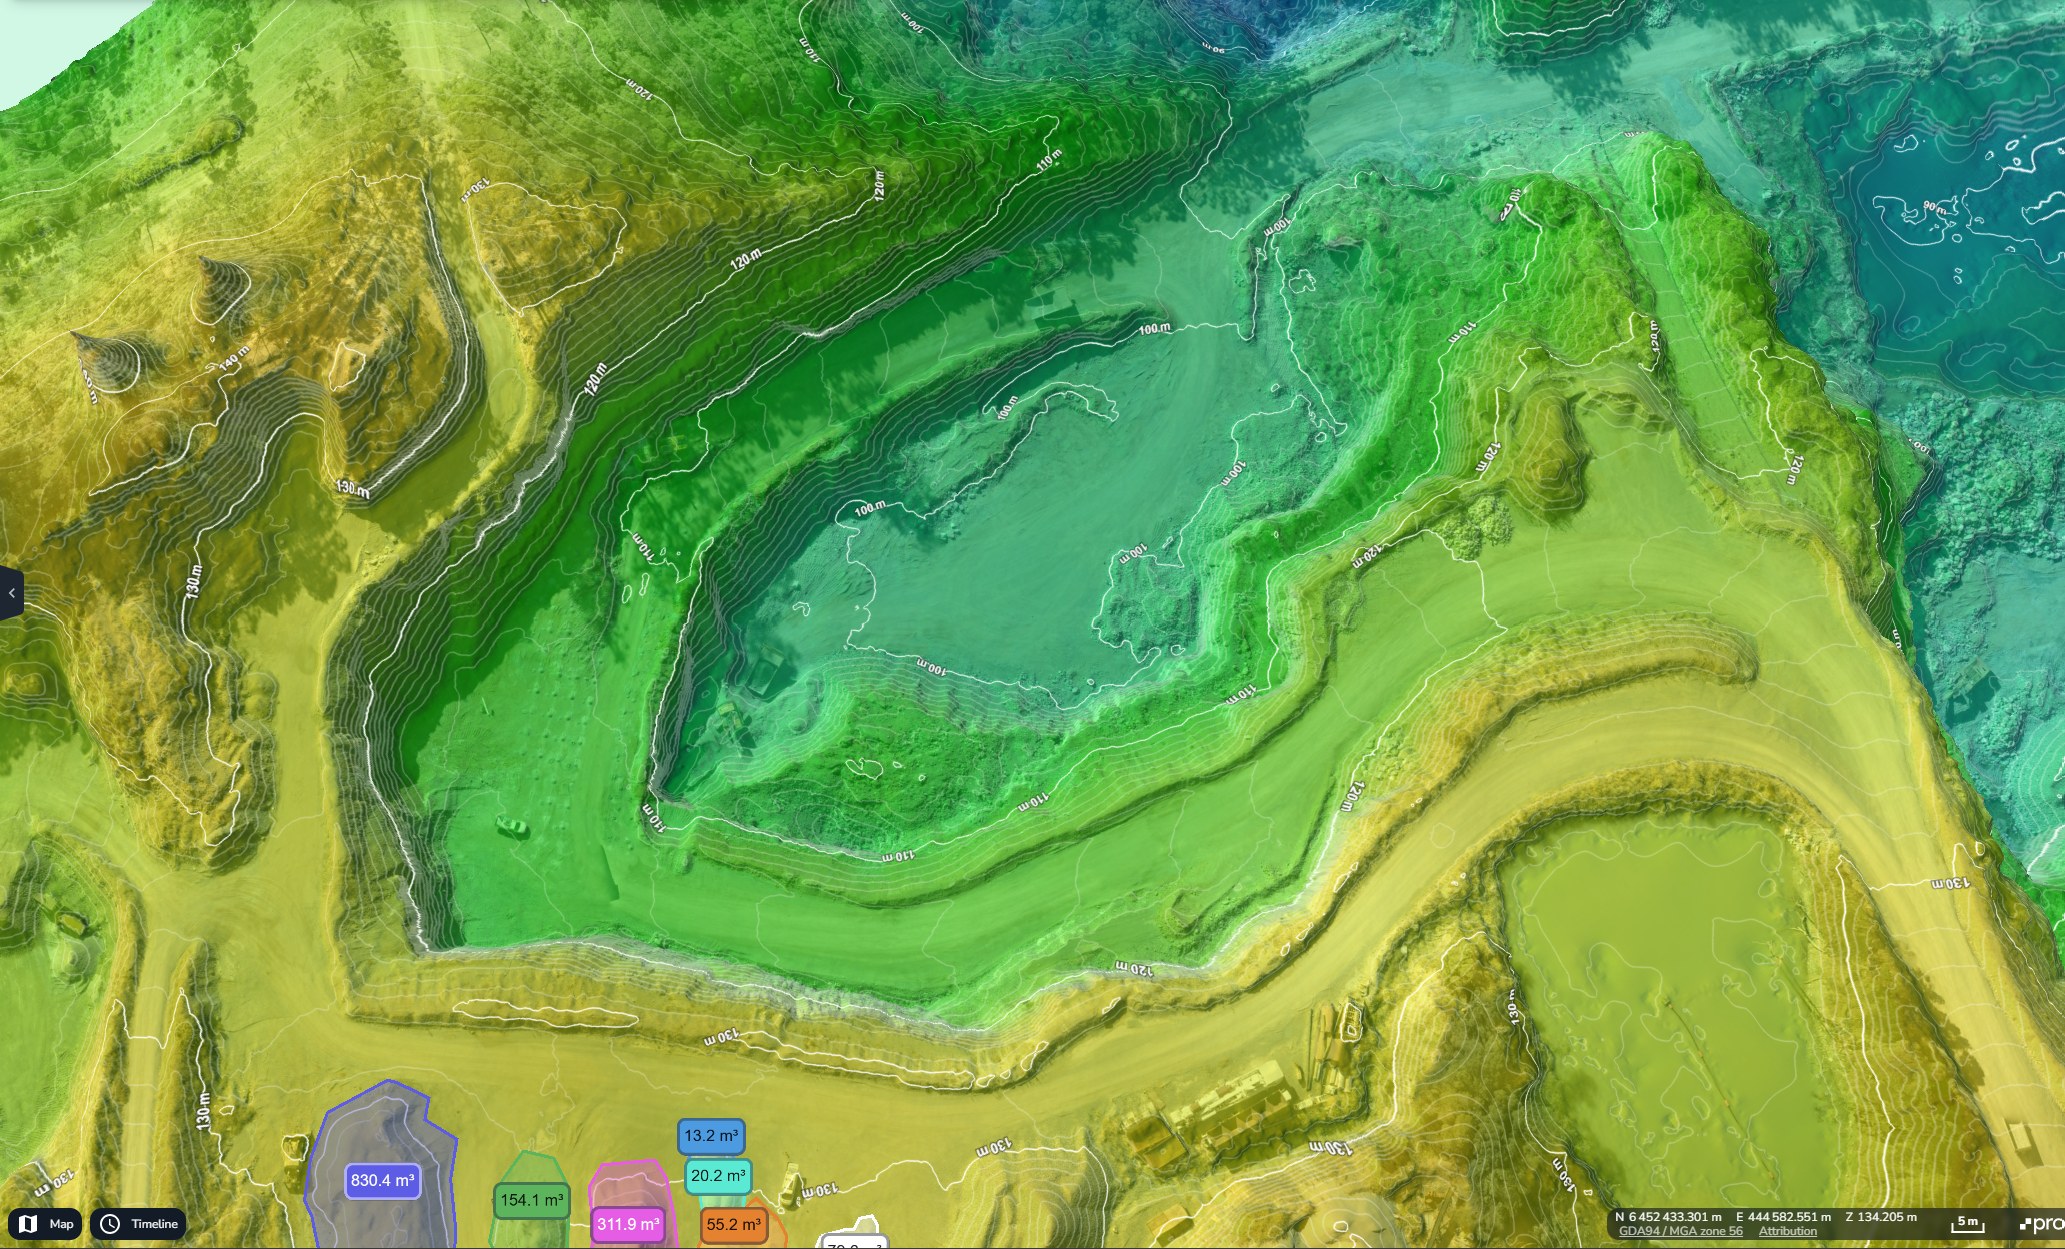
The first survey creates a baseline: an orthomosaic and a 3D surface of the frontage. Later surveys repeat the same flight plan and survey control, so each new surface can be compared with the last to show where ground has been lost or gained.
The result is a measured, dated record of how a cliff, dune or beach is changing, which supports monitoring, planning and discussions with landowners and other stakeholders.
Practical uses
- Monitoring cliff-face changes
- Comparing coastal terrain between dates
- Documenting erosion-prone areas
- Mapping beach and dune surfaces
- Producing visual records of coastal change
- Supporting environmental and coastal management teams
Coastal outputs
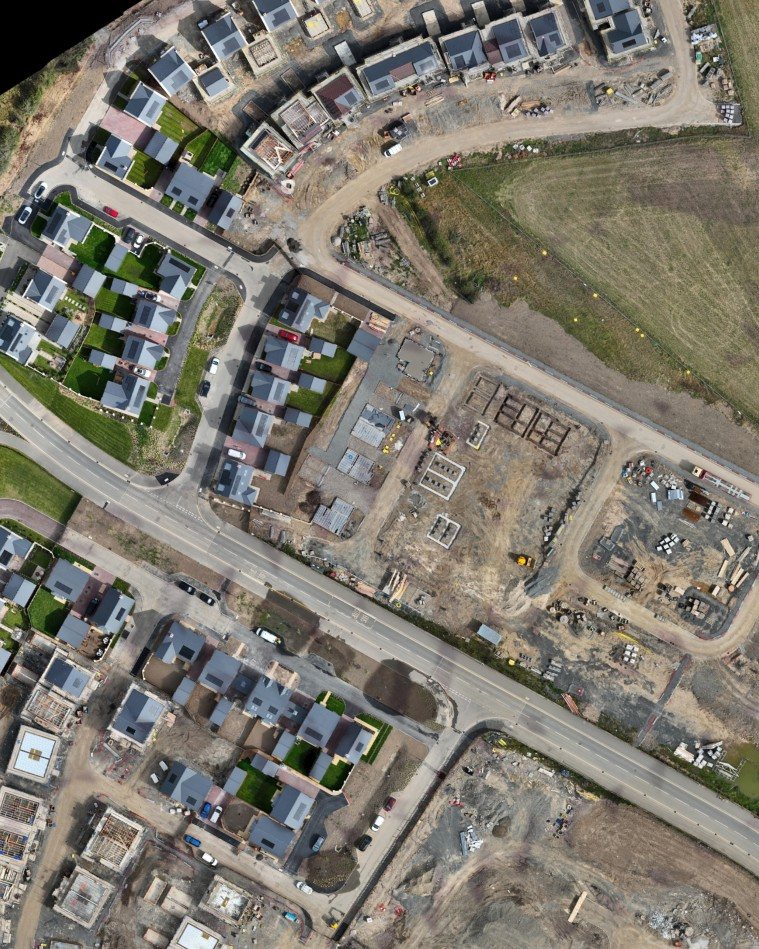
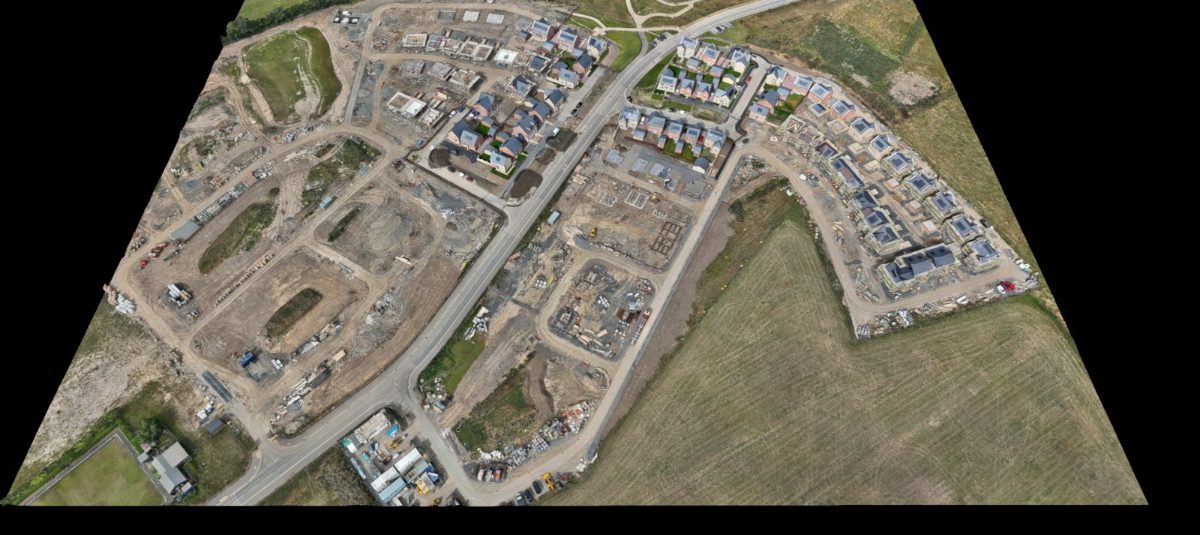
Orthomosaics, surface models and change maps for each survey date.

What you receive
- Coastal orthomosaicsGeoTIFFHigh-resolution, georeferenced maps of the frontage
- Surface and elevation modelsGeoTIFF, LandXMLMeasured 3D surfaces for each survey
- 3D coastal modelsBrowser link, OBJTextured models of cliffs and defences
- Repeat-date comparisonsPDFSurveys compared date by date
- Change visualisationsPDF, GeoTIFFMaps showing erosion and deposition
- Volumetric changePDF, CSVVolumes lost or gained, where technically appropriate
How the work is done
- ObjectivesWhat needs monitoring, how often and what decisions the data will support.
- PlanTide times, access, permissions for protected sites, airspace checks and RAMS.
- BaselineThe first survey, with stable ground control set back from the edge.
- RepeatThe same flight plan and control at each interval, timed around the tide.
- CompareSurfaces compared, with change maps and volumes where appropriate.
What affects change detection
Change detection is only reliable when surveys are comparable. That needs consistent survey control on stable ground, similar flight parameters and similar conditions between visits. Very small changes can be smaller than the difference between two surveys, and results are reported with that in mind.
Vegetation limits photogrammetry: on vegetated dunes and cliff tops, the ground beneath the plants cannot be measured from the air. Tide state, wet sand, waves and spray also affect what can be captured. The right approach depends on the site and the monitoring objective, and we will say plainly where the data has limits.
What affects the result
- Stable ground control between surveys
- Tide state and wet sand
- Vegetation on dunes and cliff tops
- Wind, light and spray on exposed coasts
Frequently asked questions
How is coastal erosion measured using drones?
A drone survey creates a 3D surface of the coast. Repeating the survey later with the same control and comparing the surfaces shows where material has been lost or deposited, and by how much.
Can two survey dates be compared?
Yes. That is the core of monitoring. Two surveys on comparable control are compared to produce change maps and, where appropriate, volumes.
Can you measure cliff retreat?
Yes. The position of the cliff top and face can be compared between surveys and retreat measured along fixed sections. Steep or overhanging faces need extra oblique photography to be captured properly.
Can dunes be monitored with photogrammetry?
Bare sand maps well. Where dunes are covered by marram grass or other vegetation, photogrammetry measures the top of the vegetation rather than the sand beneath, which limits the change that can be detected there.
How frequently should coastal mapping be repeated?
It depends on how fast the frontage is changing and what the data is for. Seasonal or annual surveys suit many sites, with extra surveys after major storms.
Related services
All services